

The BLS jobs numbers are actually pretty good
The monthly jobs estimate isn't rigged. It's also not super accurate. But it is useful.
At the beginning of this month, President Trump fired Bureau of Labor Statistics Commissioner Erika McEntarfer based on unfounded claims about “rigged” data. There is no evidence of any sort of misconduct or political influence in the production of the jobs numbers. One hundred percent of economists say that the numbers are not politically biased. The reality is that the President was upset about the report of a slowing economy and wanted someone to blame.
Given the lack of evidence for the President’s outlandish claims, administration officials critics quickly turned their focus to the historical accuracy of the monthly jobs numbers instead. In this process, a number of people have made errant claims about the data, including defenders of the Bureau’s work. In order to better understand the role and the value of the jobs numbers, we need to understand where these numbers come from.
The “jobs number” in the BLS monthly employment report comes from the Current Employment Statistics (CES) program, a.k.a. the payroll survey. The survey1 asks businesses to provide the number of employees on payroll, as well as their hours and wages. The headline jobs number produced by the program reflects the total number of net jobs gained or lost each month.
There is an initial estimate released for the prior month. This estimate is then revised in the two subsequent employment reports, based largely on additional responses to the survey. Later on, the series of jobs numbers is adjusted again, to align with actual jobs counts from the Bureau’s Quarterly Census of Employment and Wages (QCEW). This process, known as “benchmarking”, doesn’t do much to correct the monthly change estimates. It serves mainly to bring the total jobs levels back in line with reality.
So how good are the initial estimates from the CES? It’s an important question. Unfortunately both critics and defenders of the data are making some important errors in attempting to answer it. Here are three crucial facts about the jobs numbers:
1. Revision size is not an measure of accuracy.
Several attempts to both critique and defend the BLS jobs numbers treat the difference between the initial estimates and the revised estimates as a measure of the survey’s error. This is a mistake, as the revised estimate does not reflect the true change in employment, but is merely an updated estimate from the same program. Treating revisions as errors is analogous to assessing the accuracy of Nate Silver’s August election forecast by judging it against his October forecast, rather than judging it against the actual results of the election. As mentioned earlier, the true number of the jobs gained or lost in any given month is knowable. It is released several months later as part of the Bureau’s QCEW program, which is based on mandatory unemployment insurance filings.
2. The CES attempts to estimate the net monthly change in jobs, not the overall level of employment.
This error, coming mostly from defenders of the CES numbers, argues that the error in the jobs numbers is actually tiny by comparing the error size (typically around 100K) to the total jobs level (approaching 160M), rather than to the net change in jobs. This misunderstands the methodology and purpose of the program, which is explicitly designed to measure the change number, and only produces the jobs levels by applying the estimated change percentages to the previous month’s employment levels. As discussed above, the levels are ultimately anchored to previously-released QCEW counts.
Furthermore, total employment tends to change by less than 0.2% each month, so regularly achieving a small “error rate” in the estimate of total employment is an extremely low bar for a statistical project. In reality, the CES is designed to do something much more difficult, and more useful.
3. Accuracy is subjective. What matters is whether the estimates are useful.
Whether the estimates are considered accurate or not depends on whether the they contain useful information. In the case of the CES, larger errors might be offset by their timeliness. The estimates are typically released on the first Friday of the month following the month that is estimated. The true jobs numbers are not known until several months later, which is too late to be useful for many purposes, such as setting monetary policy.
My analysis below reveals that while the estimates might appear inaccurate based on the magnitude of the errors, they still contain useful information that would otherwise be unavailable so early.
What the Data Shows
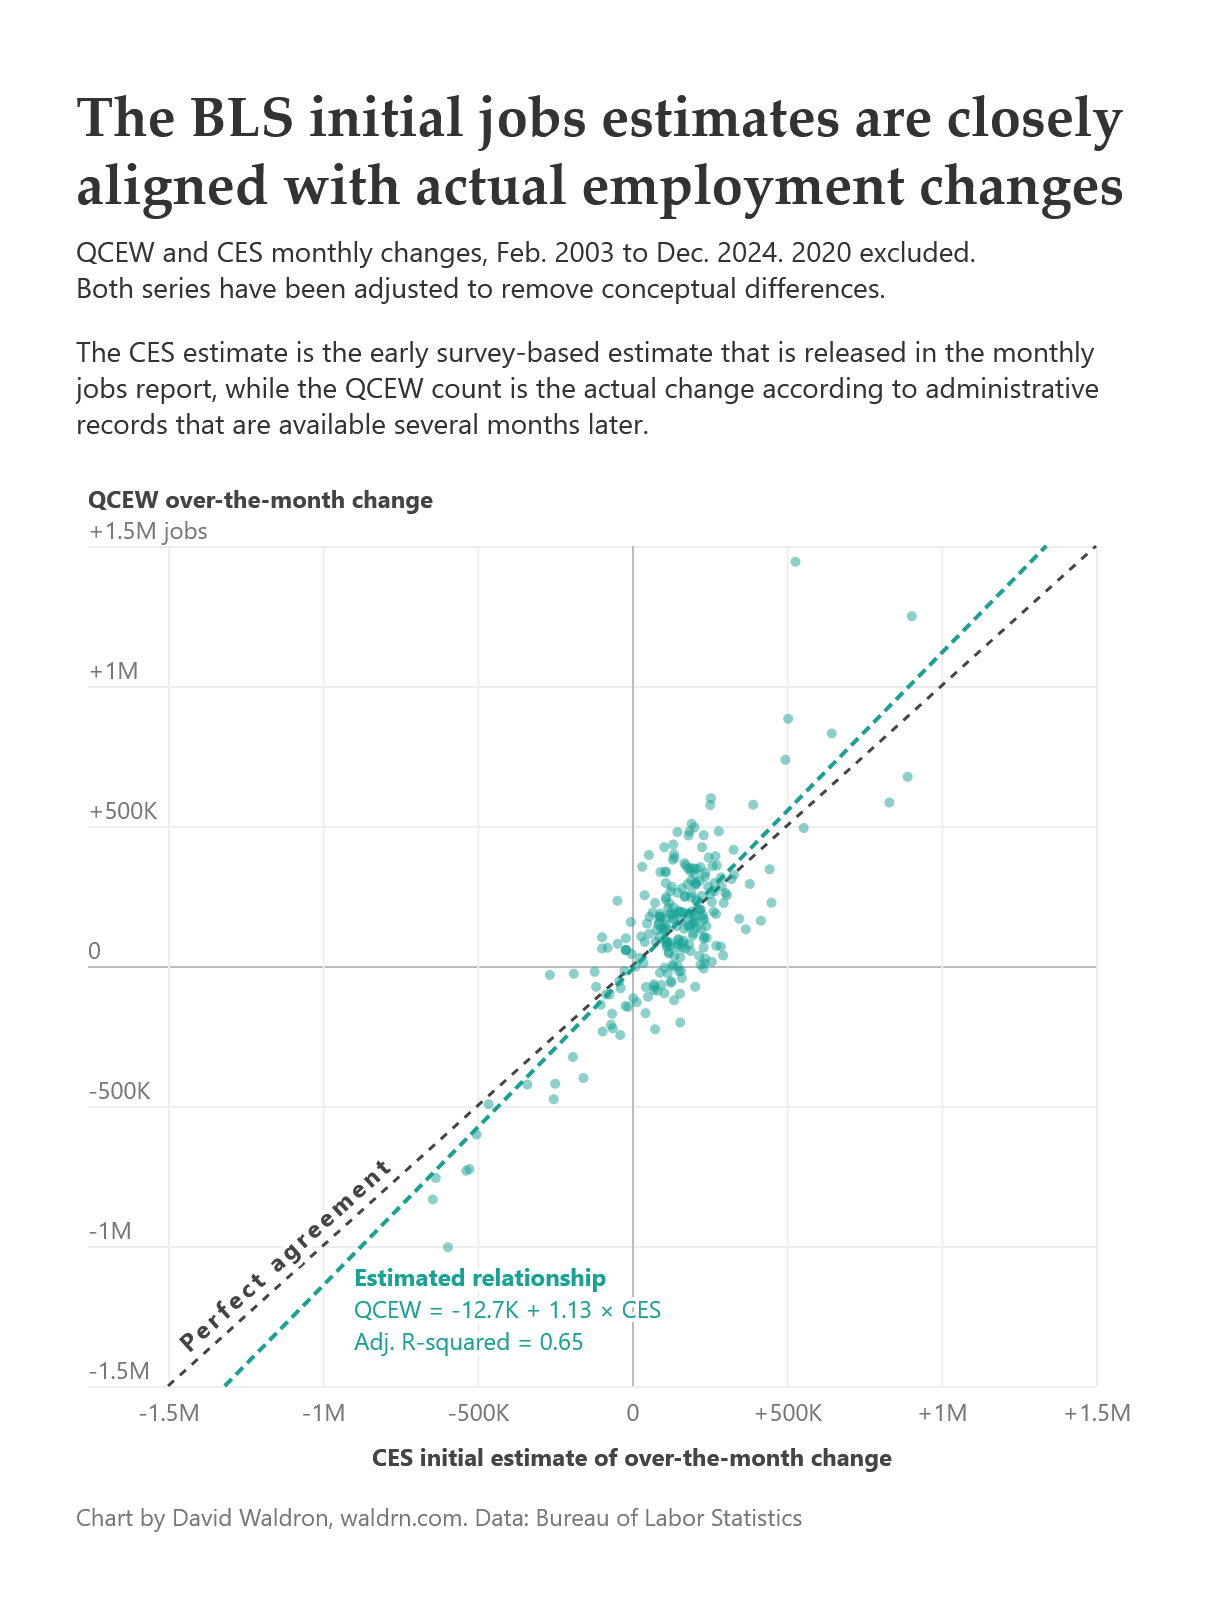
The correct way to assess the initial CES estimates is to compare them to actual counts from QCEW2. Doing this, I find:
CES initial estimates of over-the-month changes explain 65% of the variation in the actual employment changes, suggesting that they almost certainly contain useful information for policymakers.
The unexplained variation is still significant. This means the initial estimates tend to be off by 126K jobs on average over the comparison period.
The CES initial estimates tend to understate the magnitude of changes in employment by around 11.5%, so an initial estimate of 200K jobs gained actually predicts a gain of around 226K, on average.
Furthermore, the estimates have minimal overall bias, tending to understate the monthly change in jobs by just 4.4K over the entire period.
All in all, this is a fairly impressive feat. BLS is reliably capturing information about monthly employment changes in almost real time. There might be some question about the appropriateness of how the news media reports on the monthly numbers. Economists have long warned that the numbers have large error ranges and suggested that the initial estimates receive disproportionate attention compared to the longer term trends and revised estimates. But the numbers still appear to be useful for policymakers.
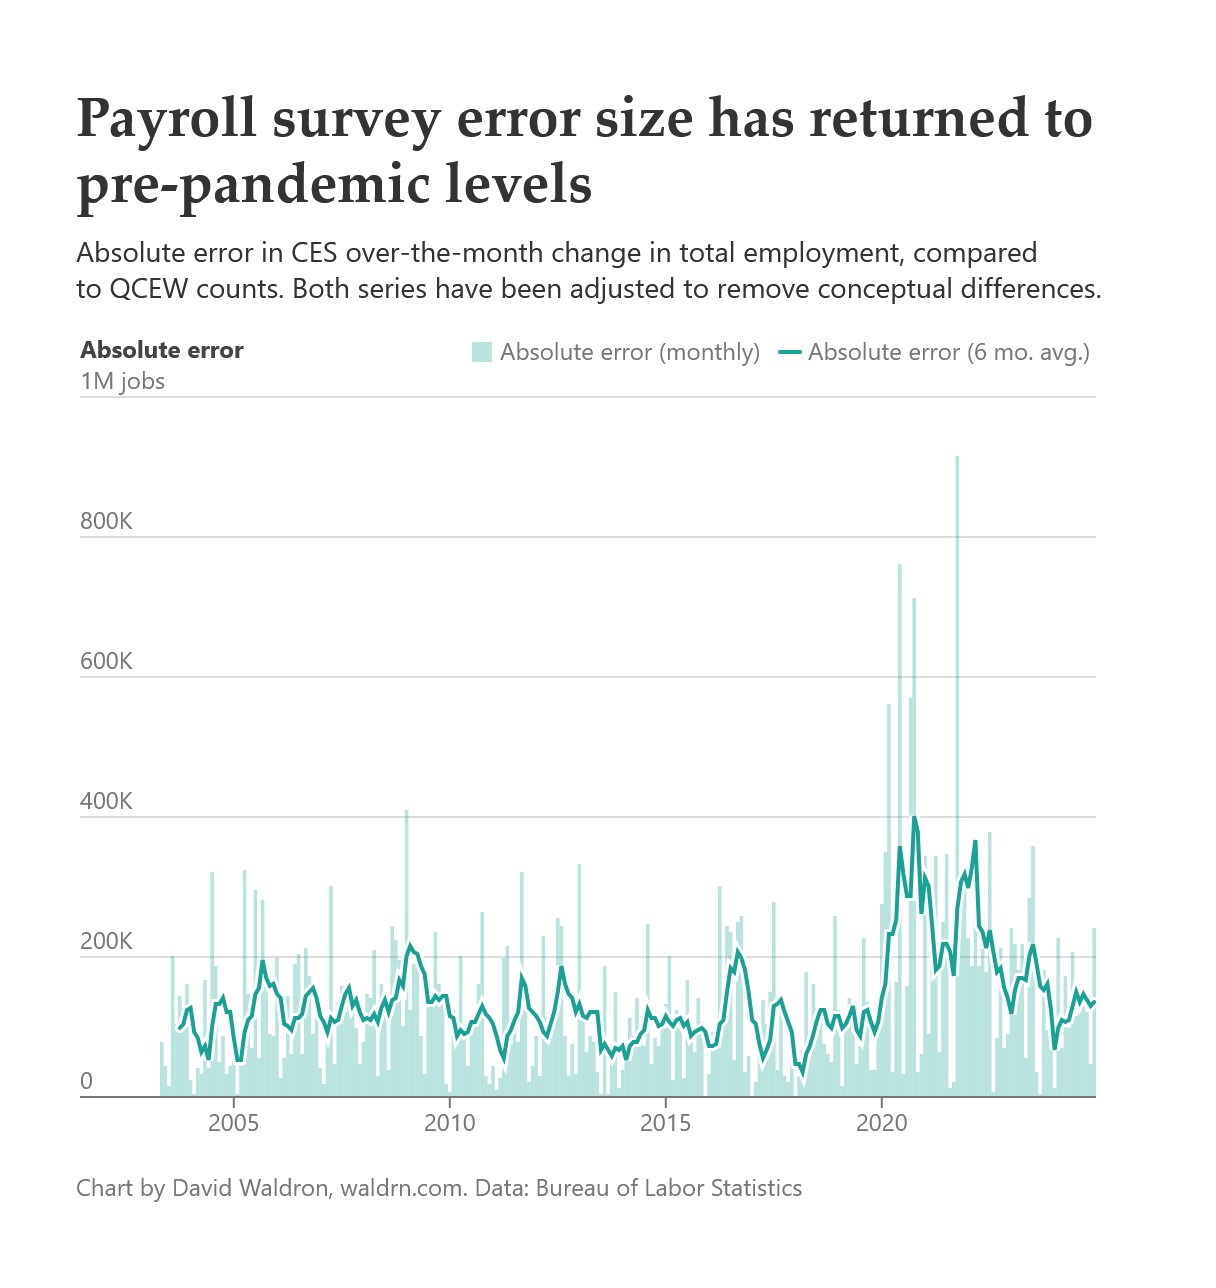
Tracking the errors over time reveals some interesting trends. Specifically, the absolute error has tended to hover slightly above 100K, except for the period from 2020 to 2022, where it more than doubled. This is likely due to lower survey response rates that began during the COVID-19 pandemic. Since 2022, the error rates seem to have returned to normal.
Error direction
The net error of the CES initial estimates over longer periods such as presidential terms has remained small, as positive errors tend to cancel out negative ones over time. Under Bush and Obama, the CES initial estimates understated actual job growth by an average of 4.7K and 15.7K jobs per month, respectively. Under Trump’s first term, the net error was slightly negative, understating job growth by just 300 jobs per month. Under Biden, the net error was slightly positive at 9.3K jobs per month.
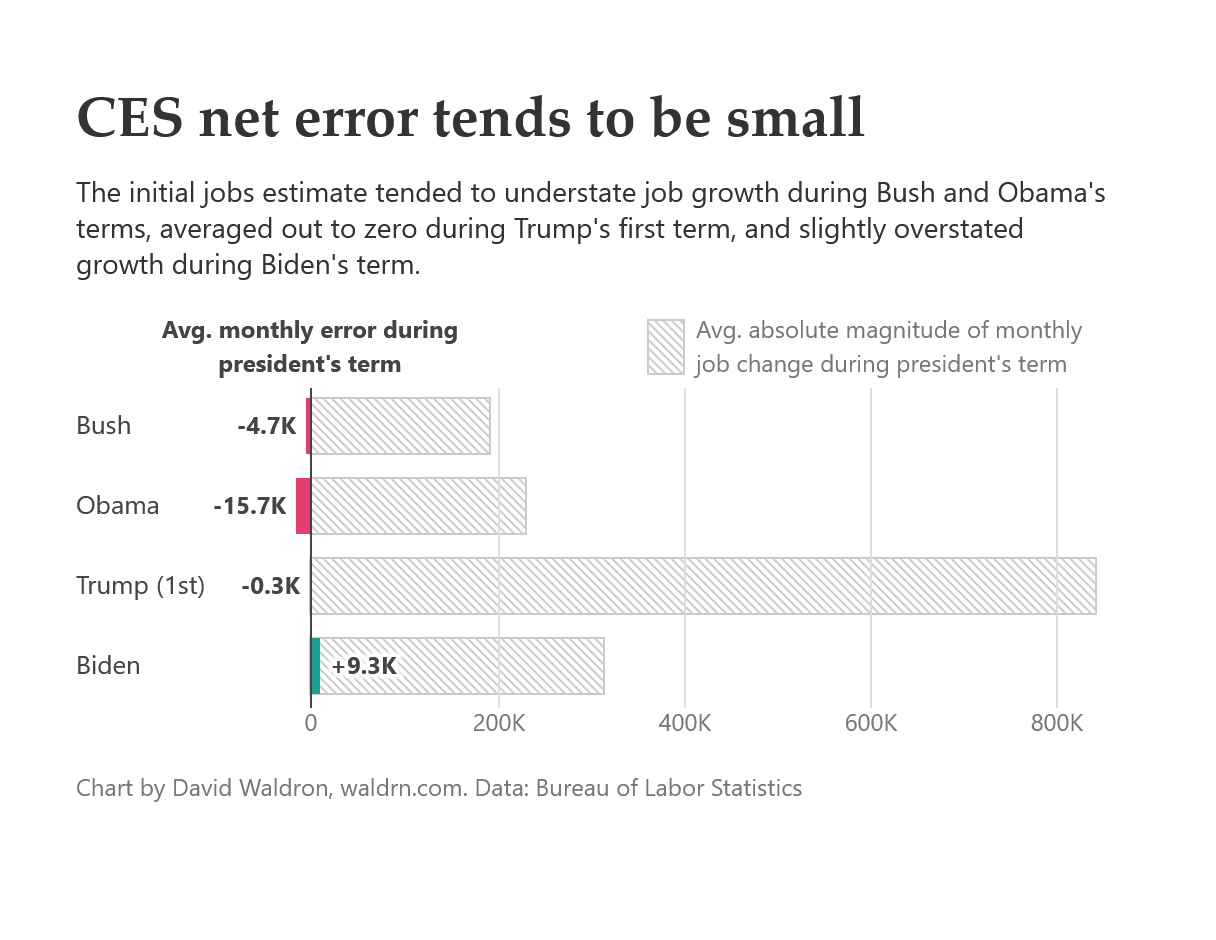
These are all small numbers considering the absolute magnitude of the net change has averaged 334K jobs per month from 2003 to 2024.
Private alternatives have less value
The main private alternative to the CES estimates is the ADP National Employment Report. This report is usually released two days prior to the BLS report, but only covers private payrolls. Evaluating these estimates against QCEW private employment suggests that they are not better than the CES estimates.
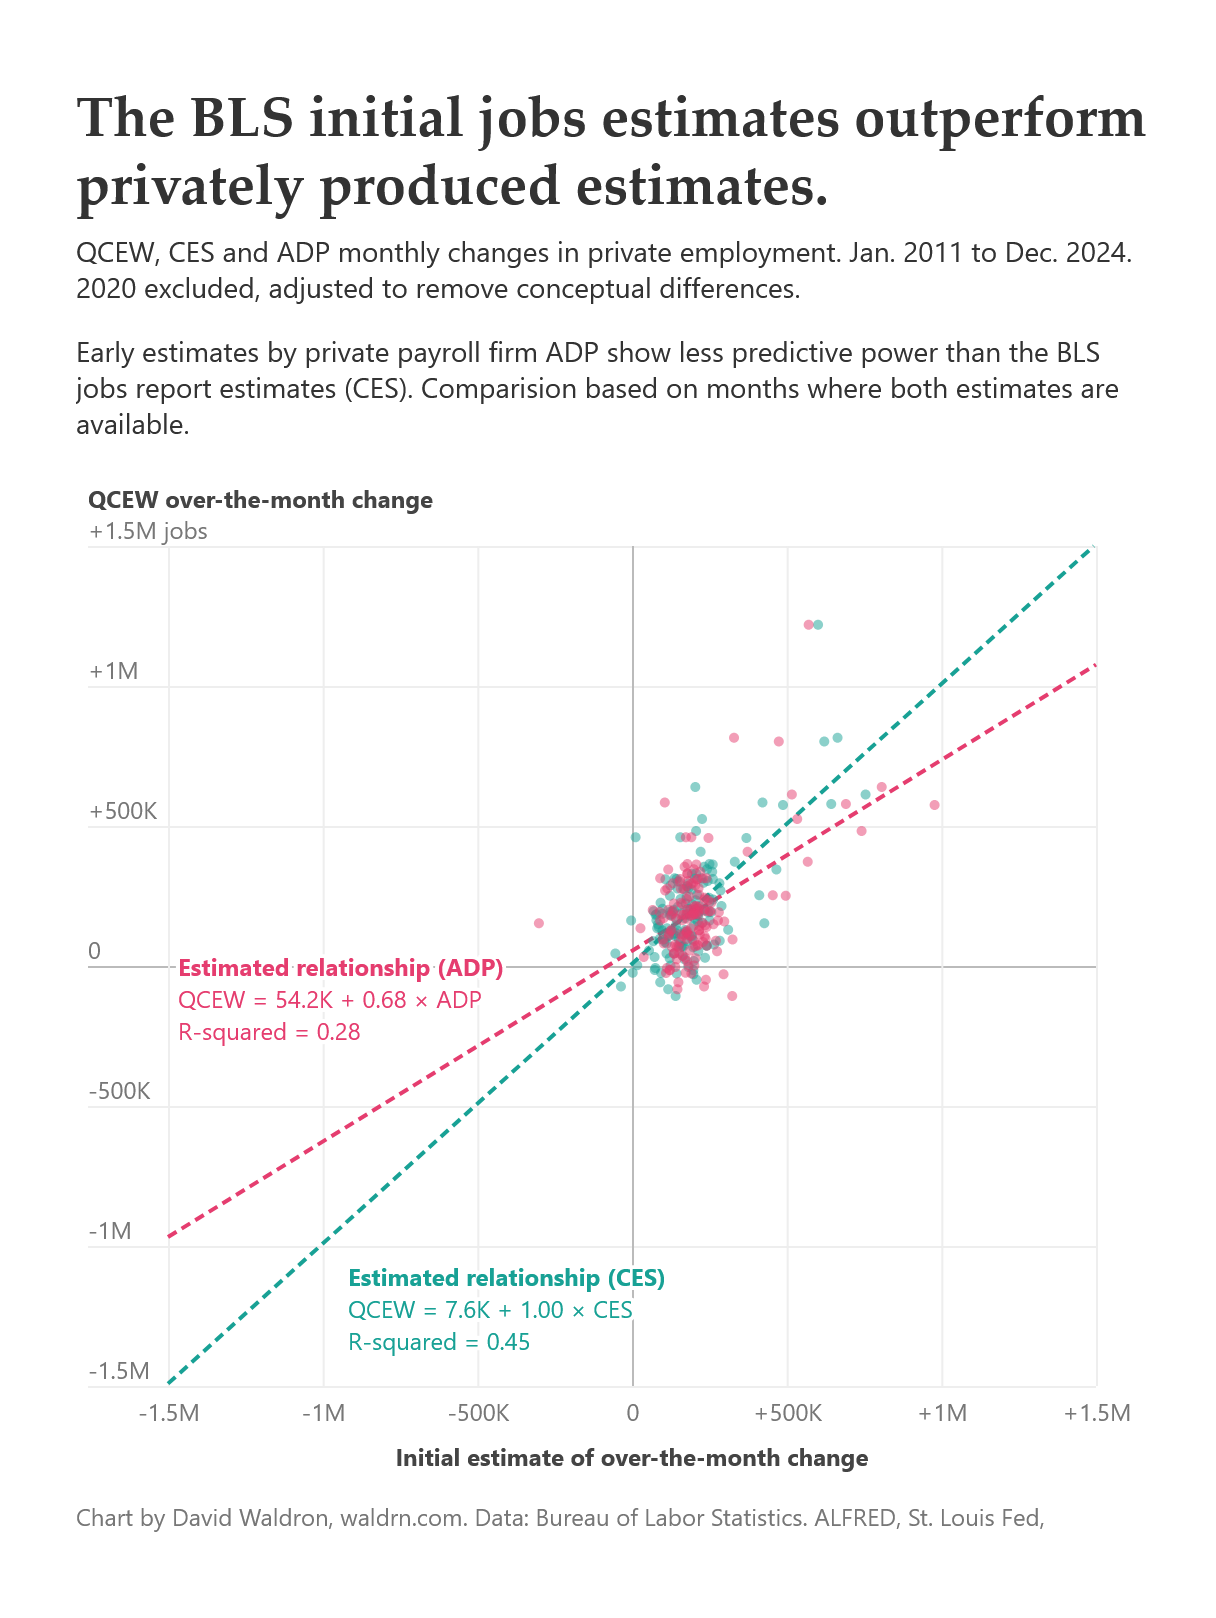
During months where both reports’ data are available, ADP estimates appear to be slightly inferior to the CES estimates in predicting the actual change in employment. It explains less variation in the monthly change (28%) than the CES (45%), and it overestimates the magnitude of the changes by 47%. Plus, the ADP estimates are only available for private employment and contains less detailed breakouts than the CES numbers.
But perhaps more importantly, privately-produced numbers lack the transparency and oversight that have driven the U.S. government to consistently produce high-quality data for the benefit of the public. The BLS and other statistical agencies have built up technical and bureaucratic barriers to political and other external influence. The President’s political attacks on the BLS threaten these safeguards, and subsequent claims about the accuracy of the data appear to be unfounded.
All of the code and data for this analysis are available here.
The program also includes a non-survey component, a birth-death model that attempts to estimate jobs added and lost through business opening and closing
A few tweaks are necessary to make this an appropriate comparison:
QCEW includes jobs that are covered by unemployment insurance, or 97% of total employment. To make appropriate comparisons, I remove a handful of industries that contain high proportions of non-covered employment from both the CES and QCEW series.
QCEW is not released with seasonal adjustments, so I apply seasonal adjustments to the QCEW series using the same program that BLS uses to adjust the CES series.
I also exclude 2020 from the comparisons because the unusually large changes in jobs numbers dominate the estimated relationship between the two series. Including 2020 would make the CES estimates appear almost perfect, due to the fact that the initial estimate for April 2020, the single largest monthly change in employment in U.S. history, was nearly identical to the actual result (-19.59M estimate vs. -19.63M actual). In doing this, I’m setting a higher bar for CES to clear in order to appear accurate.
QCEW data for 2024 is not final. It has one more revision due in September 2025.
Very nice! I did not know the survey was meant to capture month-to-month changes, I only noticed it was often used this way.