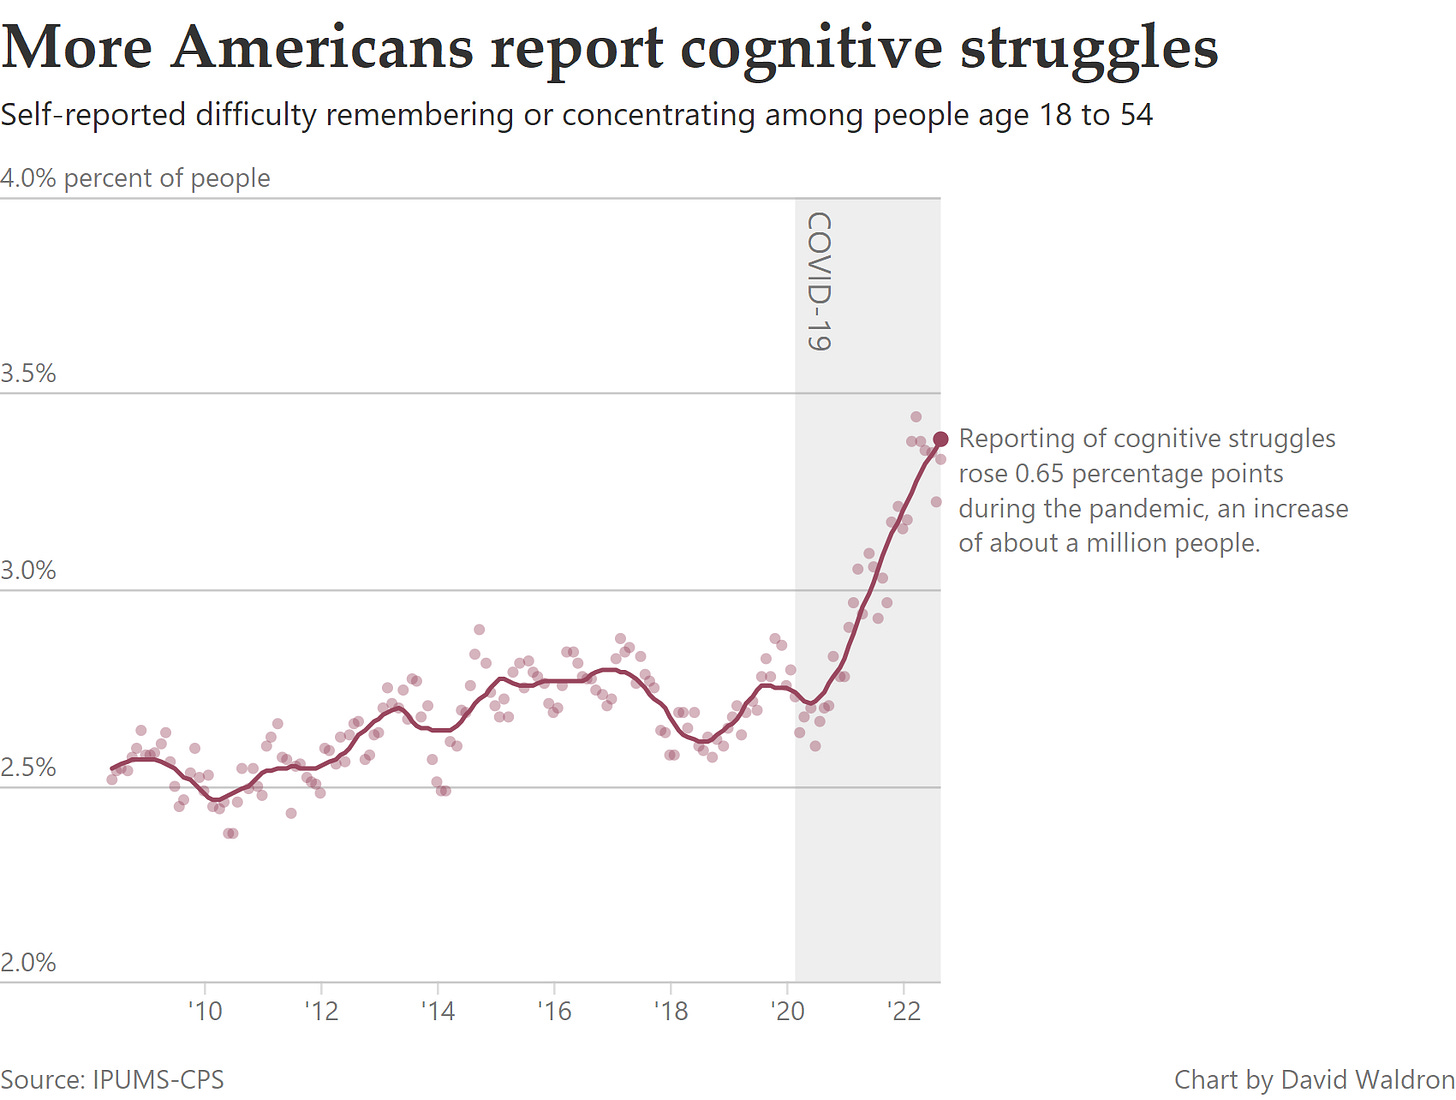
More Americans are reporting difficulty with memory and concentration
Increase might represent long-term effects of COVID-19 infections
I recently saw this chart about increasing reports of disability in the Current Population Survey and wondered, “what kinds of disability are increasing?” It turns out, there is one particular type of disability that is in the rise.
The number of Americans age 18 to 54 reporting serious difficulty remembering or concentrating has been increasing throughout the COVID-19 pandemic. Prior to the pandemic, about 2.7% of this age group reported this disability. In September of 2022, that percentage has reached 3.4%.
Over 80% of Americans are estimated to have had COVID-19 at least once. The CDC recognizes “brain fog”, difficulty thinking or concentrating, as one of the potential long-term effects of COVID-19. So it seems plausible that this increase in self-reported cognitive impairments is caused by COVID-19 infections.
Other types of disability have not increased as much. Disabilities related to hearing, seeing or doing errands are slightly higher than immediately before the pandemic, but within the range of past estimates. There has been no increase in reports of disabilities related to mobility or personal self-care.
One curious feature of the increase in reported cognitive disability is that it only shows up among younger adults. Among people age 55 and over, there has been no increase1.
The increase in these symptoms is concerning. But there are questions about how to interpret self-reported cognitive impairment. There is often a disconnect between self-reported, perceived cognitive impairment and objective measures of cognitive ability. Many studies2 find a relationship between perceived cognitive impairment and symptoms of depression, but a weak relationship with objective cognitive function. But this also means that it is also possible that cognitive impairment is under-reported, since many people who undergo cognitive decline might not recognize it enough to report it on these surveys. COVID-19 has already been found to lead to increased cognitive deficits and dementia, but unlike the survey results reported here, the increase occurs mostly among older adults.
The dip in disabilities reporting early in the pandemic might be a result of survey response rates collapsing in 2020. Response rates have mostly recovered since then


Interesting, but I don’t know if I would attribute it to long COVID, necessarily. I've been teaching at a community college for about the past decade. In my classes, the number of disability accommodations for psychological conditions such as ADHD and ASD seem to really be accelerating in recent years. My guess is that this is a result of higher rates of diagnosis for relatively minor cases. This is partly because of greater awareness, and the dates in this chart also coincide with the popularity of TikTok for Gen Z, which seems to fuel a lot of self-diagnoses. In my experience, I only know one person with long COVID, but I know several adults who have been diagnosed with one of these conditions in the past few years.
Hi! These data are really interesting. I would like to ask permission to show screenshots of these graphs at an upcoming presentation at SXSW (South by Southwest). Not for publication or recording, but just to show on-screen during our panel presentation. We are talking about marketing and advertising, but I want to make the point that it is harder than ever to connect with people. Please let me know? I have reached out to the CPS as well, but I wanted to ask you also for permission to use your visualization. Thank you!!!