

Here's why there are more disabled workers in 2022
Higher employment rates of disabled people mostly reflect increased rates of disability.
I wasn't planning on returning to the topic of COVID-19 and disability so soon, but on Monday, Eric Feigl-Ding posted this chart based on a blog post by a New York Federal Reserve researcher. It shows the sharp increase in disabled workers in 2022 relative to 2019.

In response, several pundits and economists claimed that this increase actually just represents disabled people finding employment at higher rates, due to tightening labor markets and new remote work options.
Note that the claim in this tweet is incorrect. The New York Fed’s report doesn’t say that. You might not guess it from his description, but the title of the report is, “Long COVID Appears to Have Led to a Surge of the Disabled in the Workplace”, and its thesis is that COVID-19 was a mass disabling event and accommodations will be necessary to help those who are now working with long-term COVID-19 symptoms.
It seems strange to me that people are arguing that the increase in disabled workers doesn’t reflect an increase in disability, since there has clearly been a large increase in self-reported disability. But few of the experts who ridiculed Ding’s tweet seemed concerned with actually disentangling the two factors. So I’ve just gone ahead and done it, decomposing the change in disabled working-age adults, by employment status, between 2019Q3 and 2022Q3.
To calculate composition effect, I simply apply 2019 employment rates by age, sex and disability status to the 2022 population. This estimates the amount of change that is caused by changing composition of the working-age population.
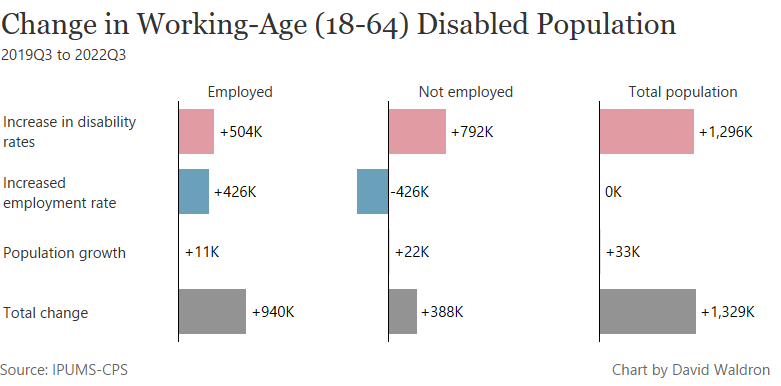
I find that overall, there was an increase of 1.3 million disabled people in the 18 to 64 age group. This increase contributed 504 thousand people to the increase in disabled workers, and 792 thousand to disabled non-workers. Higher employment rates in 2022 can be credited with shifting 426 thousand disabled non-workers to workers. In other words, increased disability accounts for 53.6 percent of the increase in disabled workers, while higher employment rates account for 45.3 percent. Population growth accounts for the remaining 1.1 percent increase.
It is important to note that if the increase in reported disabilities is composed of less severe disabilities, such that people are more likely to be employed, my estimate will understate its contribution to the increase in disabled workers. This seems probable.
A different analysis of this question by researchers at the Brookings Institution attributes the entire increase in labor force participation among disabled people to increased rates of disability, and none to other factors. It looks to me that the main difference between my analysis and theirs is that they use the 2017-2019 trend in labor force participation as a counterfactual, rather than just the 2019 level. That might be reasonable, but I'm not sure that I could justify it.
The strange thing about this whole business is that it is obviously true that self-reported disability has increased by a lot among working-age Americans. That seems to be Ding's main point, but the chart he chose can't quite prove it because it only shows workers. Whether disabled workers are now employed at higher rates doesn't affect the overall increase in disability, it just changes how they break down by employment status. While I've been clear that the increase in self-reported disability is tricky to interpret, I find it odd how many economists seem eager to ignore this trend altogether. It's great that remote work and tight labor markets might have benefits for disabled people. But pointing that out doesn't require waving away another trend.