

About 30% of Americans live paycheck-to-paycheck, and that's bad
A summary of what we can know about people's liquid savings in 2022
There's been a persistent debate among policy pundits about what percent of Americans live “paycheck-to-paycheck”, which is interesting because it’s not that difficult to get to a reasonable answer. Senator Bernie Sanders frequently cites that 60% of Americans are in this situation, which irritates some fact-checkers who insist that it's false.
Two recent attempts to defend Sanders' assertion come from Seth Ackerman at Jacobin and Matt Bruenig at People's Policy Project. While everyone ends up using the same dataset (the 2022 Survey of Consumer Finances), we also get a lot of stretching of definitions and chopping off sections of the dataset to try to get it to match Sanders’ stated estimate.
The Technical Questions
Not all of the definition-stretching and data filtering is unreasonable. I’ll accept the chosen metric of days of income in liquid savings. I’ll also accept restricting the universe to working-age Americans, since neither elderly people nor children tend to be depending on their own paychecks.
As far as how many days of income in liquid savings consitutes living paycheck-to-paycheck? There is really no need to fuss around on this one. Only 10% of American workers are paid less frequently than semimonthly, and the most common paycheck frequency is biweekly. Someone who is living paycheck-to-paycheck would have anywere from 0 to 14 days of liquid savings at any particular moment.
Ackerman's main move to get his number to 60% is to exclude business owners from the calculation. His reasoning is that these folks probably disregarded the survey instructions to exclude business accounts when listing personal assets, which causes their business wealth to be counted as personal savings. The editor at Jacobin doesn’t offer much evidence that this happened except that business owners are wealthy, so we just have to accept his theory that the survey fails to capture the true financial struggles of the capital-owning class. I won’t accept this because I think the real reason that business owners appear wealthy in the survey is that business owners tend to be wealthy. And even if business owners do sometimes intermingle personal and business accounts, those accounts still represent a liquidity source that provides financial security which is the entire point of this question.
The Answer
Of households where the head is age 25 to 64, an estimated 30% had less than 14 days of liquid savings in 2022. Moving the number of days in either direction shows the sensitivity of the estimate to the definition changes. About 20% had less than 7 days of savings, and 47% had less than 30 days of savings.
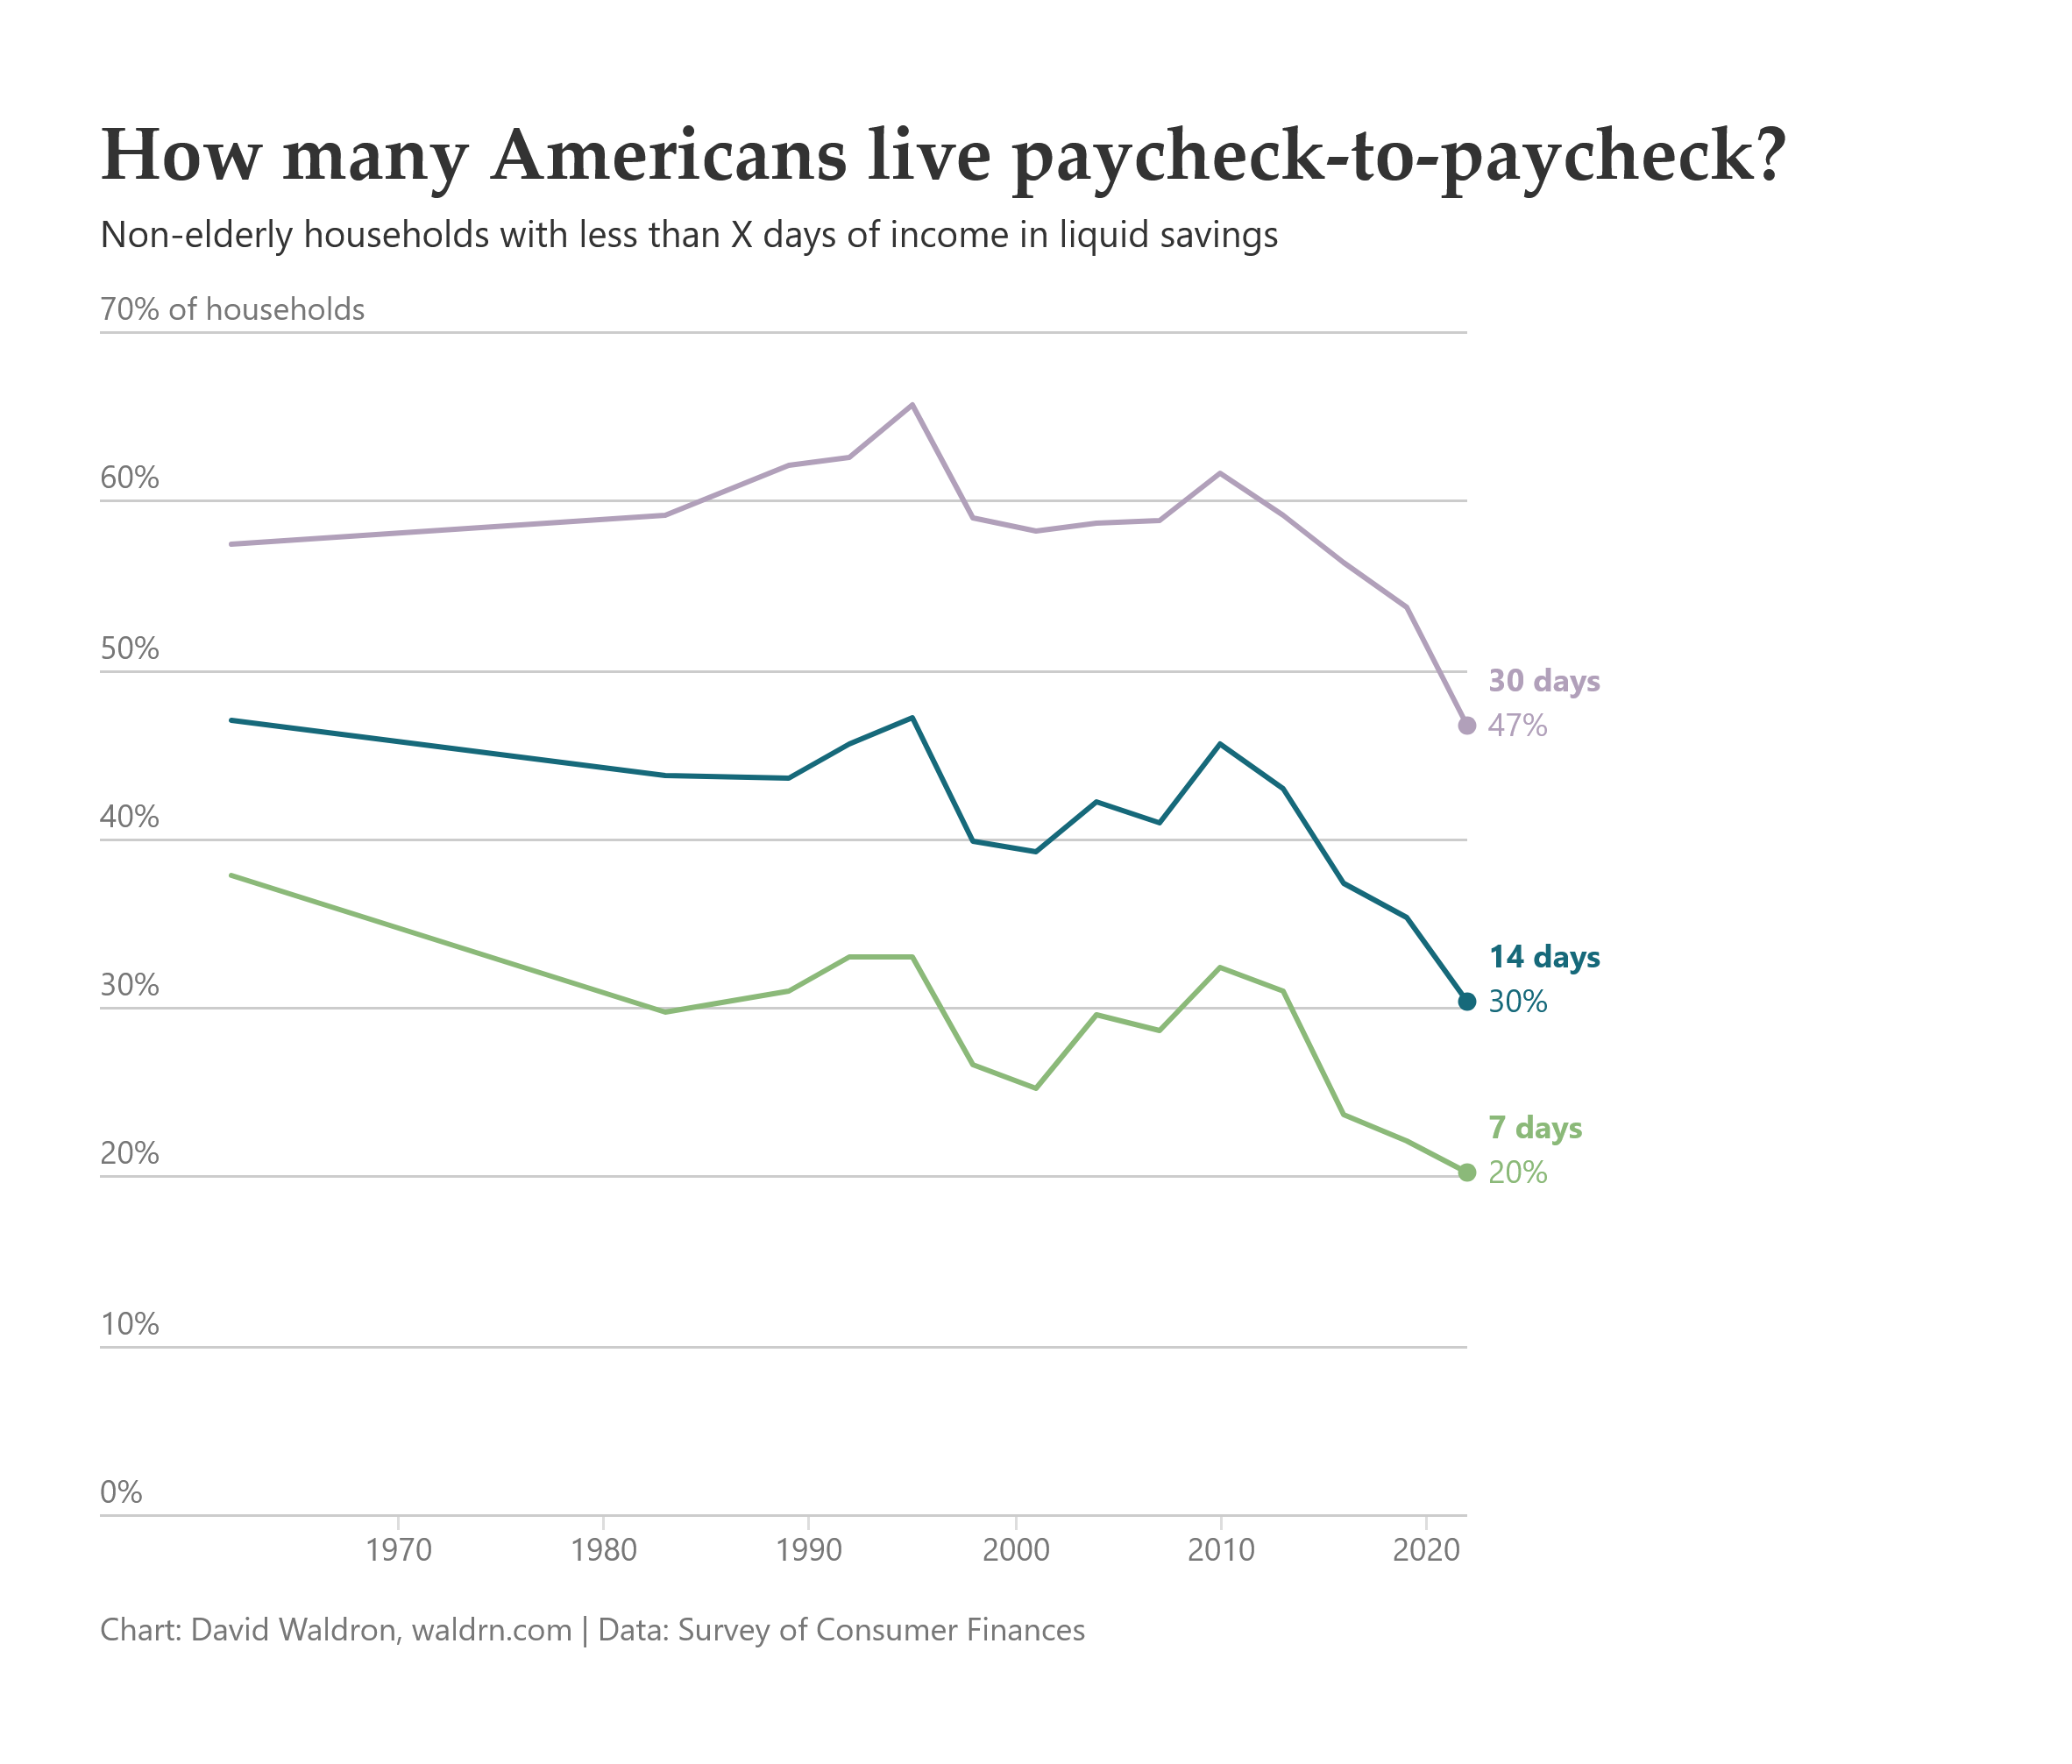
One thing that is striking is that these percentages were at historic lows in 2022. The financial cushions of American households have actually improved significantly over time, especially from 1995 to 2022. Ackerman suggests that things might have worsened significantly since 2022, which might be true. But until the next set of data comes out, it is still speculation. Certainly some excess savings from temporary pandemic assistance programs may have been drawn down, but also the economy has continued to expand continuously since 2022.
The Points We're Missing
This debate over precise percentages has probably obscured some more important points. First, having very little financial cushion is bad, so we should acknowledge when it improves. And since much of the improvement in 2022 might be attributed to policies Sanders has supported, such as pandemic assistance and the expanded child tax credit, he should take some credit for it.
But also, even at these historic lows, having only two weeks of savings is a precarious state, and 30% of American households are in it. There is no need to inflate this statistic at all. It is a bad number!
Sometimes one metric doesn’t capture everything that’s wrong. It’s fine to talk about more than one thing. Ackerman gets around to this at the end of his article when he addresses the relative inequality of improvements to people’s financial conditions. Many people are better off, but the biggest benefits have been to people who were already financially secure.
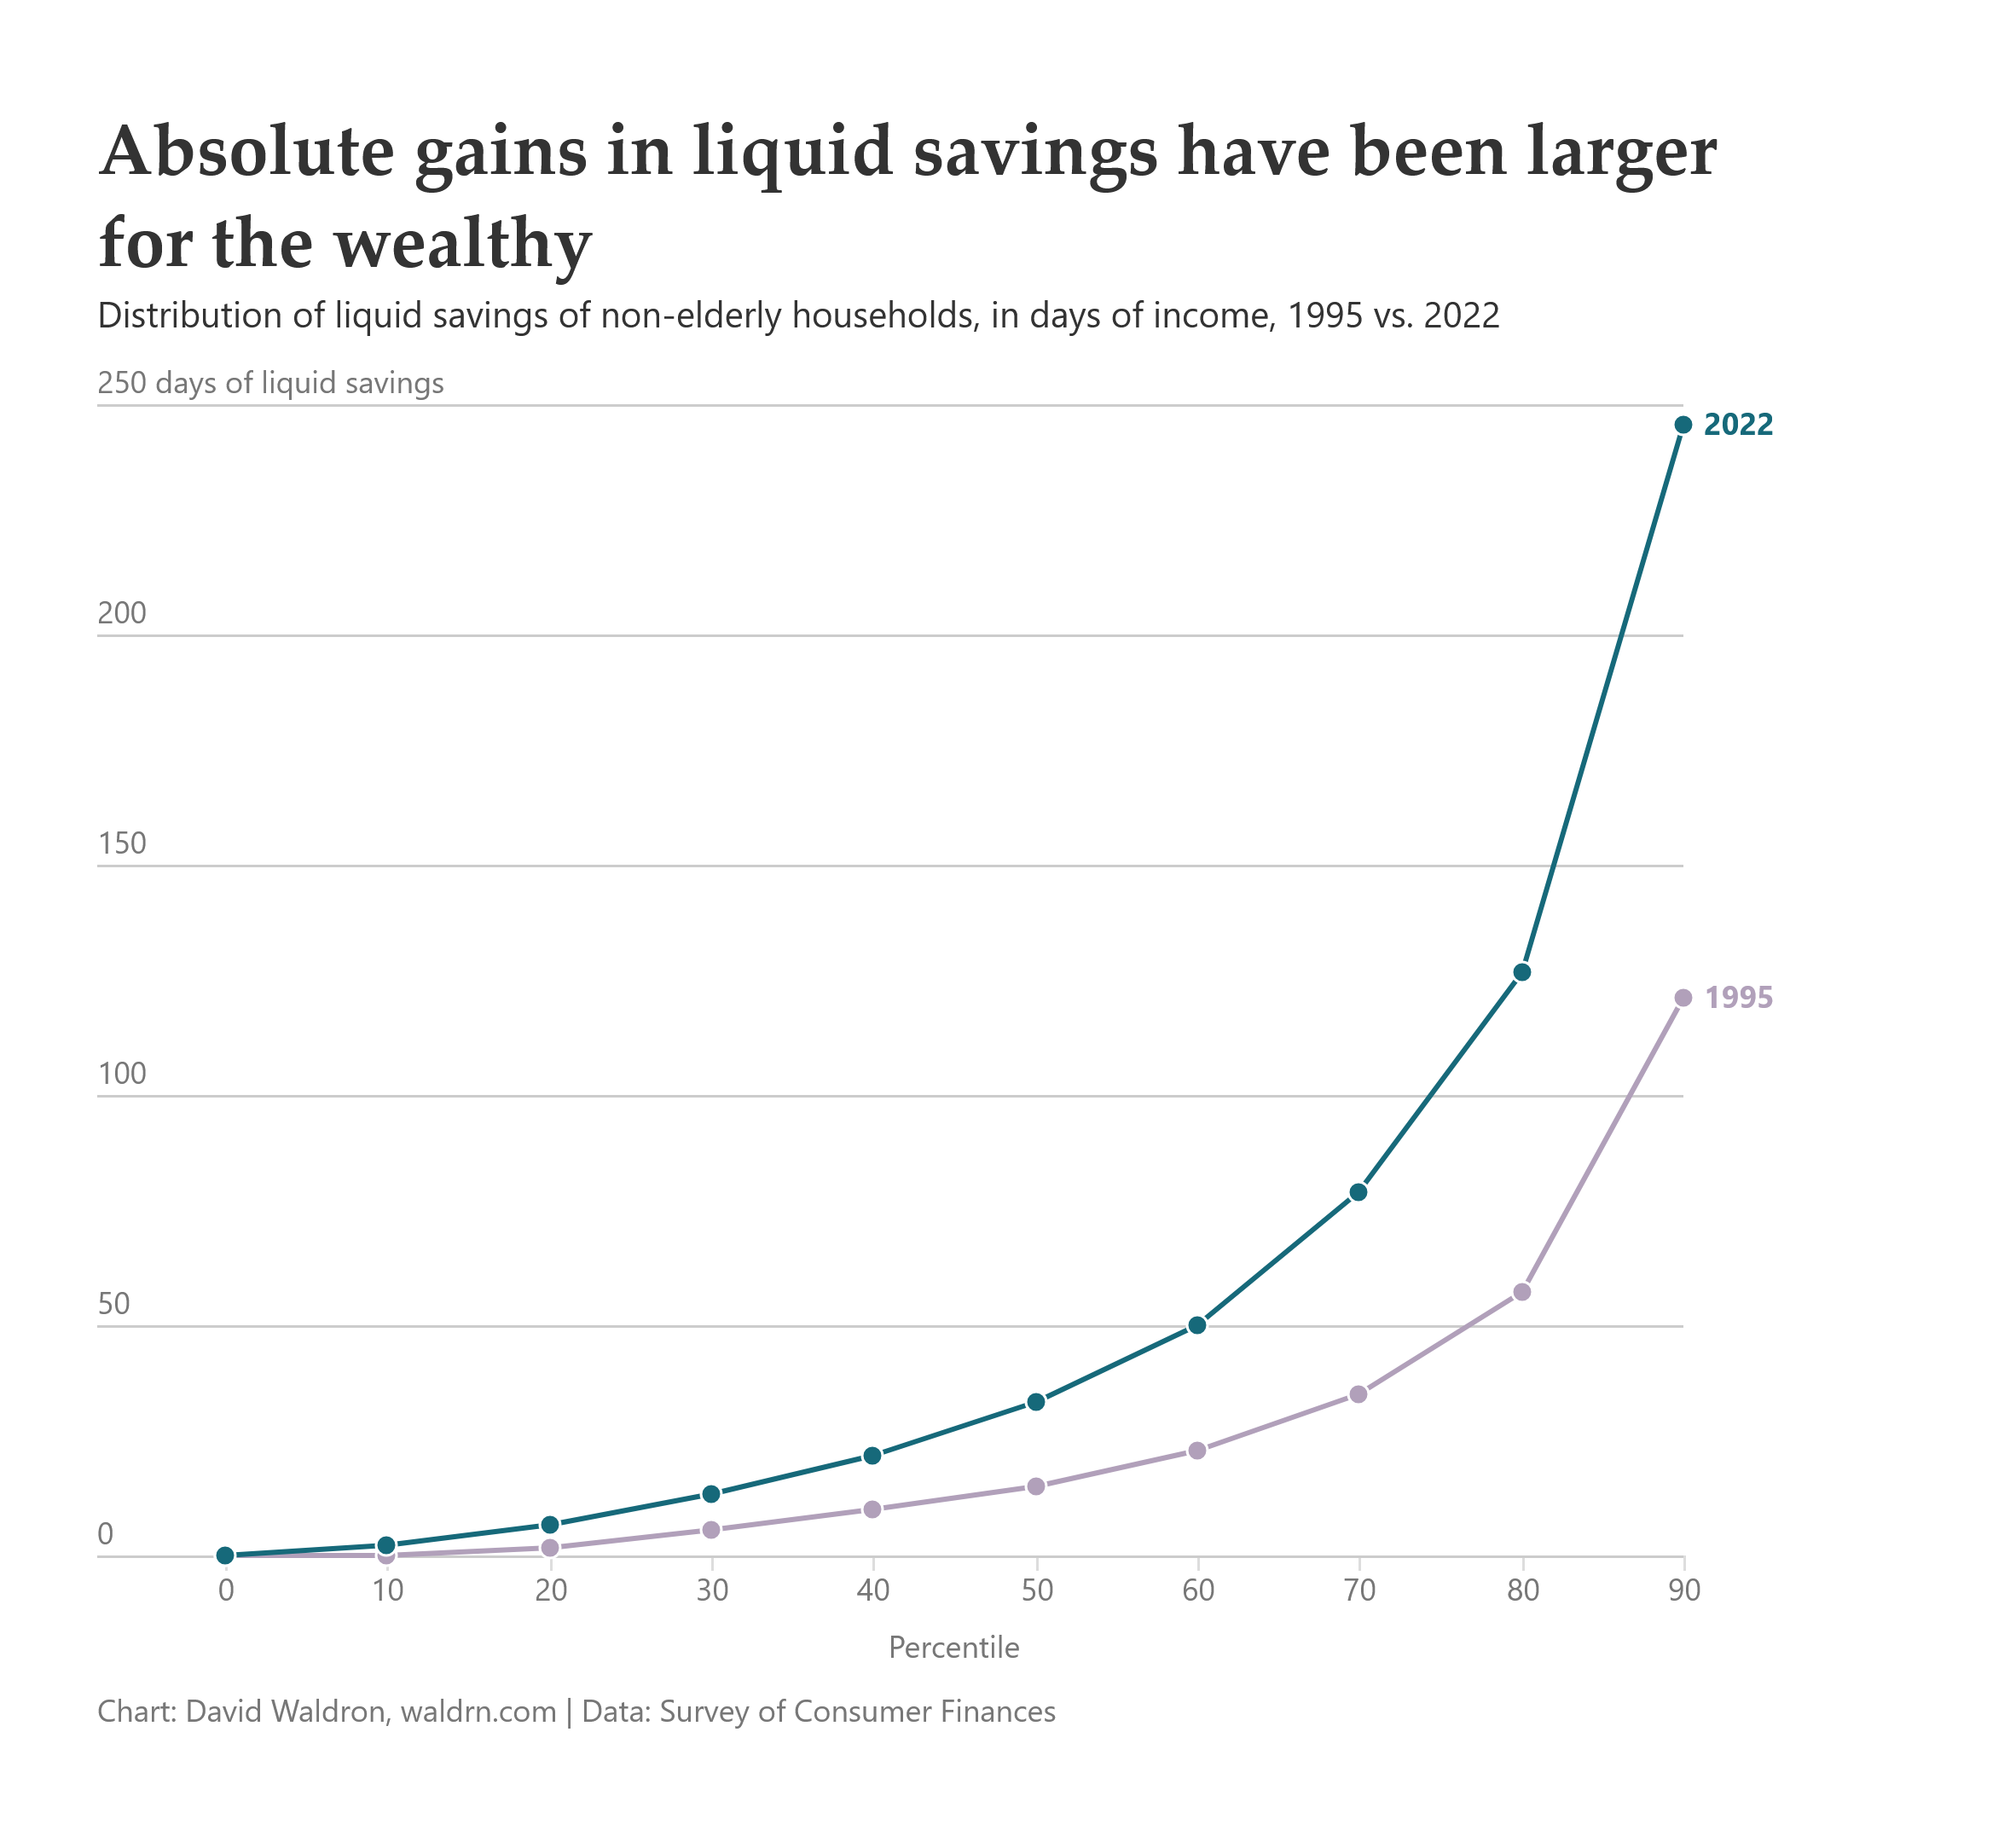
Since 1995, liquid savings at the 80th percentile increased from 57 days of income to 127 days. This dwarfs the increase at the median, from 15 days to 30 days. It doesn’t take any exaggeration to point out that there is tremendous inequality in financial security in the United States, and that the gains, while real, have not been evenly distributed.